It’s Fuel Poverty Awareness Day, so we thought we’d take a look at how we measure and define fuel poverty – and look at how the data we hold helps to understand the issue.
Definition
In England and Wales, until 2013 a household was considered to be fuel poor if it was spending more than 10% of its income on fuel (energy). After the Department for Energy & Climate Change’s 2013 publication, A framework for future action, a household is considered to be fuel poor if its fuel costs are above the national median level and if the amount of income left after paying fuel bills is below the official poverty line.
There are three components to determine whether a household is fuel poor:
- Its income
- Its energy requirements
- Fuel costs
Our data
The UK Data Services offers a range of datasets about fuel poverty including:
- English Housing Survey
- Scottish Household Survey
- Behaviours and Attitudes of the Fuel Poor in England, 2015
- 2017 Household Energy Data Asset Registry
English Housing Survey
The most widely used is the Fuel Poverty Dataset, 2015, part of the English Housing Survey. According to this study 11% of all households in England are classed as fuel poor, and almost 12% of vulnerable households (those containing children, elderly or someone with a long-term illness/disability).
Overall, there are over 2 million fuel-poor households in urban areas, 227,000 in semi-rural areas and 263,000 in rural areas, adding up to over 2.5 million households across England.
The Fuel Poverty Energy Efficiency Rating (FPEER) lists dwelling characteristics which affect the level of fuel poverty:
- Wall type – households with uninsulated walls, solid or cavity, have a higher prevalence of fuel poverty compared to insulated households (13.8% of households with uninsulated cavity walls and 18.1% of households with solid uninsulated walls are fuel poor compared with 6.2% of households with insulated cavity walls and 8.8% of insulated solid walls households).
- Floor area – previous research suggests the likelihood and depth of fuel poverty tends to increase as floor size increases. The Fuel Poverty Dataset, 2015 shows that the likelihood of being fuel poor rises from 5.8% for dwellings less than 50 square metres to a more than double figure of 14.3% for dwellings that are 90 to 109 square metres. However, dwellings with 110 square metres or more have a lower figure than those 90 to 109 square metres, 12.3% of households this size being fuel poor.
- Age of dwelling – older dwellings are more likely to be classified as fuel poor, most likely due to the energy efficiency levels at the time of construction. In 2015, 18% of dwellings built before 1850 were fuel poor, compared to only 4.2% of dwellings build after 1990.
- Main fuel type – in 2015, 17% of households using electricity were classed as fuel poor, followed by those using other types of fuels (such as heating oil, house coal, smokeless fuel) with 13.4%, and the least affected with a proportion of 10.3% were the ones using gas.
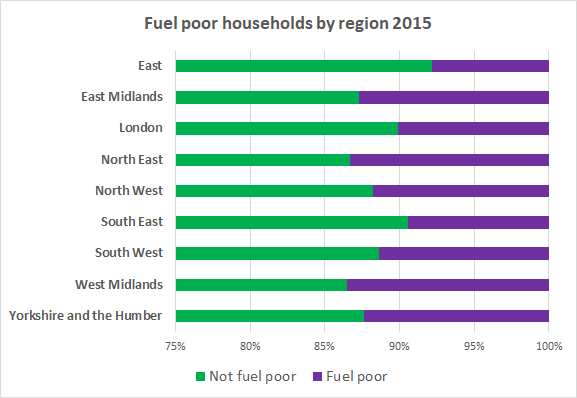
- Region – according to the 2015 data, most of the fuel poor households are in the North East (13.3% of all households in the region) with the lowest levels in the East region (7.8%), due to regional differences such as climate and income levels, depicted in the chart below.
- Area type – households in rural areas are more likely to be classed as fuel poor, which is linked to connection to the gas grid. The 2015 data show 13.6% of households in rural areas (such as villages and isolated dwellings) are classed as fuel poor and 10.8% in urban areas.
Department for Business, Energy and Industrial Strategy. (2017). English Housing Survey: Fuel Poverty Dataset, 2015. [data collection]. UK Data Service. SN: 8228,
http://doi.org/10.5255/UKDA-SN-8228-1
There is more information in the Annual fuel poverty statistics report.