It’s International Women’s Day on Sunday, so we thought we would take a look at the data we hold around one of the most researched topics of late – the gender pay gap. 1
The Annual Survey of Hours and Earnings (ASHE) 1997 – 2019, is one of the largest surveys of the earnings of individuals in the UK. Data on the wages, paid hours of work, and pension arrangements of nearly one per cent of the working population are collected. Researchers can apply to access these sensitive, controlled data through the UK Data Service Secure Lab.
ASHE provides the opportunity to research various topics including the gender pay gap. A recent comprehensive statistical release published by the Office for National Statistics (ONS) offers an insight into the topic, and discusses the main aspects influencing the gender pay gap. From the statistical release, it is well understood that the gender pay gap for full-time workers favours men in all occupations. However, it is important to understand there are several factors that affect the gender pay gap.
The gender pay gap is declining slowly
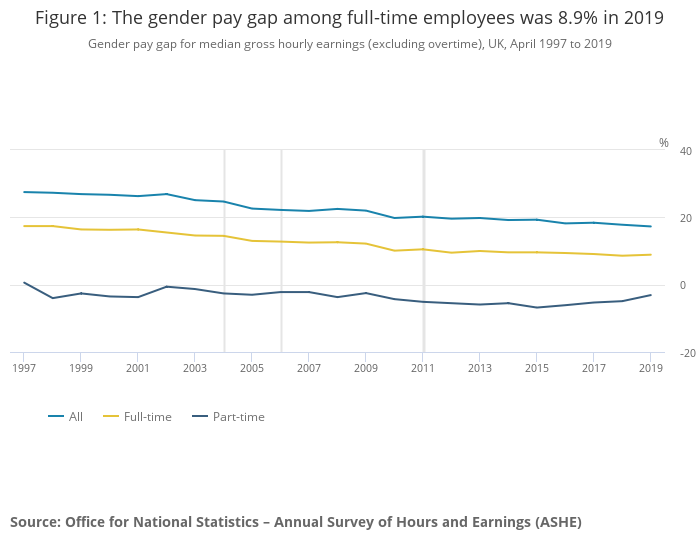
The gender pay gap in the UK has been declining slowly in recent years and the latest data shows that this trend is continuing (see Fig.1). Among full-time employees it now stands at 8.9%, little changed from 2018 when it was 8.6%. The figure for 2019 represents a decline of 3.3 percentage points from a decade ago – 12.2% in 2009 – but only 0.6 percentage points since 2012. Among all employees the gap fell from 17.8% in 2018 to 17.3% in 2019.
The gender pay gap is higher for all employees than for each of full-time employees and part-time employees. This is because women fill more part-time jobs, which have lower hourly median pay than full-time jobs, and are more likely to be in lower-paid occupations.
For age groups under 40 years, the gender pay gap for full-time employees is now close to zero
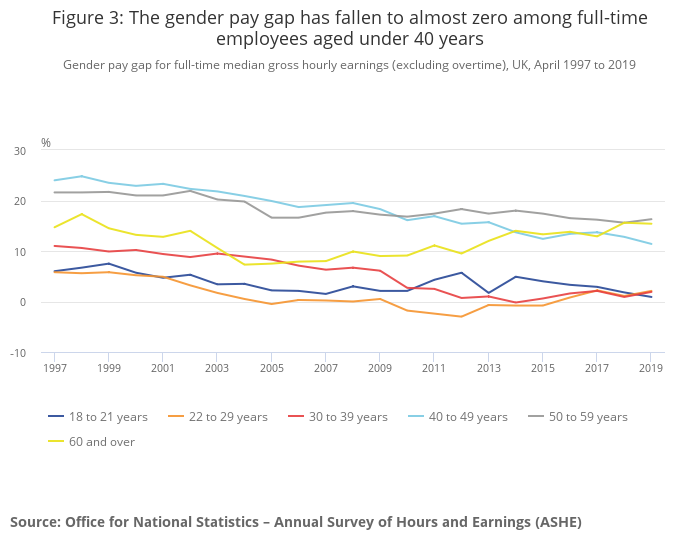
The ONS data shows the gender pay gap differs depending on the age group being studied (see Fig. 3). For age groups under 40 years, the gender pay gap for full-time employees is now close to zero. Among 40- to 49-year-olds, the gap, which is currently 11.4%, has decreased substantially over time from 24% in 1997.
Among 50 to 59-year-olds, and those over 60 years, the gender pay is over 15% and is not declining strongly over time. In the case of those over 60 years, the gap has grown from 7.3% in 2004 to 15.4% in 2019. The ONS states that the introduction in 2010 of the higher state pension age for women can be expected to have affected the working patterns of some women (more likely those in lower-paying jobs) in this age group.
The gender pay gap already stands at over 10% in the age group 30 to 39 years
Although the gender pay gap for full-time employees is close to zero between the ages of 18 and 39 years, for all employees the gender pay gap already stands at over 10% in the age group 30 to 39 years (see Fig. 4). This coincides with an increase in women working part-time from this age and suggests an important step towards women earning less per hour because part-time jobs pay less per hour than full-time jobs.
Other employment changes are also likely to have an effect as households move towards having greater caring responsibilities, often from the mid 30s upwards. For example, research conducted by the ONS has identified that, compared with men, women are more likely to leave their job over a long commute.
These factors may affect the occupations that women work in, either at age 30 to 39 years or at later ages. Occupation has been identified in research by the ONS as having a notable impact on the gender pay gap.
Figure 4: Gender pay gap for median gross hourly earnings (excluding overtime) by age group, UK, April 2019
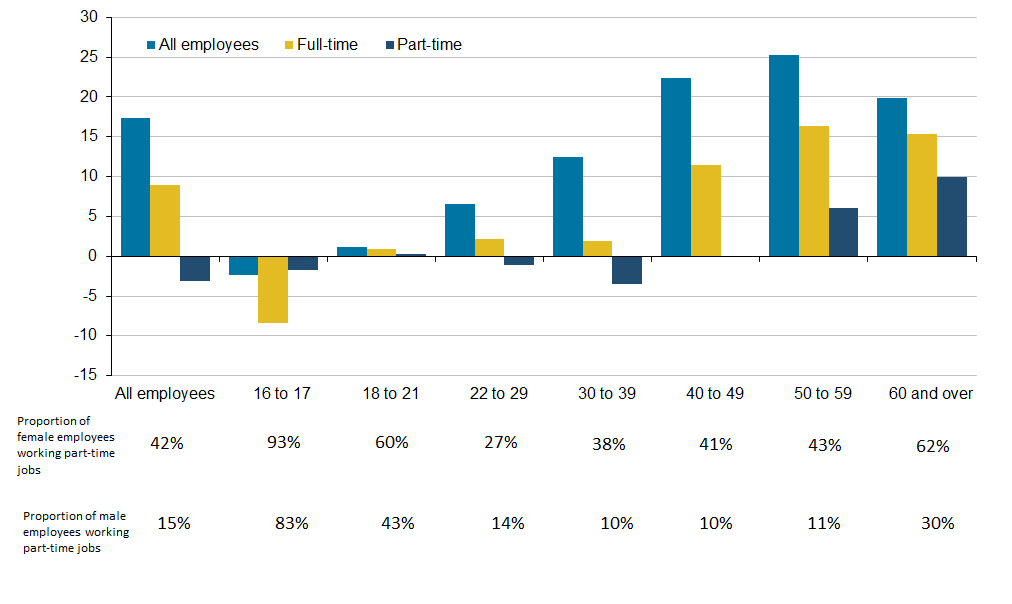
Source: Office for National Statistics – Annual Survey of Hours and Earnings (ASHE)
The gender pay gap increased among high-paying managers
Although the estimated gender pay gap among full-time employees in 2019 was not significantly lower than in 2018 (the estimate was 8.9% compared with 8.6% in 2018), it declined in seven of the nine main occupation groupings. This is one example of the complex nature and interaction of multiple factors that influence the gender pay gap.
An increase in the gender pay gap among the high-paying managers, professionals and senior officials occupation group (from 13.9% to 15.9%) had an effect on the gap, but so too did certain other changes in full-time employment profiles from 2018 to 2019:
-
The proportion of employees who held full-time jobs rather than part-time jobs increased more for women than men, but new entrants or returners to full-time jobs are likely to start from a lower pay level and may reduce average pay for full-time women employees.
-
The three occupations that saw the largest increase in the proportion of full-time employee jobs held by women were: sales and customer service, elementary occupations and process, and plant and machine operatives; these all have a lower than average rate of hourly pay and will reduce the average full-time earnings among women.
The 10% highest paid women earn a fifth less than the 10% highest paid men
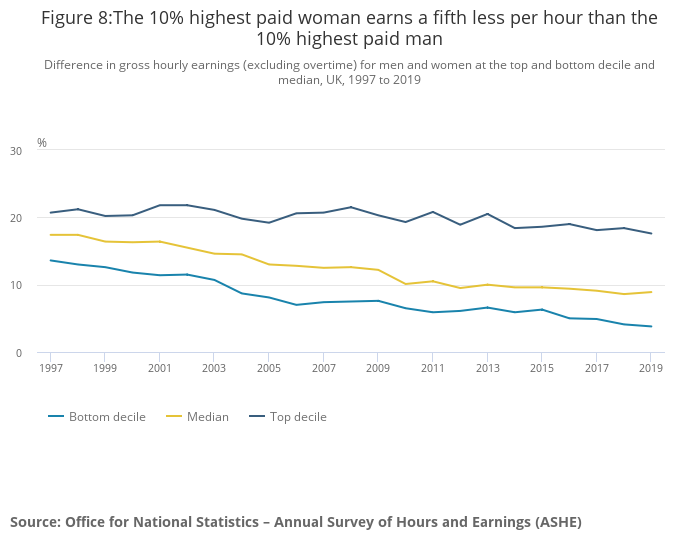
The difference in median pay for women compared with men has decreased by 8.5 percentage points (17.4% to 8.9%) since 1997. The bottom decile (that is those women or men who earn less than all except 10% of women or men full-time employees) has followed a similar pattern, decreasing by 9.7 percentage points (13.6% to 3.8%).
The top decile has shown a smaller fall of 3.1 percentage points (20.7% to 17.6%). This suggests that the higher-earning women are not converging with the higher-earning men at the same rate as medium and lower earners (see Fig 8).
1 Office for National Statistics. (2019). Annual Survey of Hours and Earnings, 1997-2019: Secure Access. [data collection]. 15th Edition. UK Data Service. SN: 6689, http://doi.org/10.5255/UKDA-SN-6689-14