About the research
Historic England is a public body that helps people care for, enjoy and celebrate England’s spectacular historic environment. They view heritage as an important source of employment which draws millions of visitors each year, provides premises for businesses, homes for residents and can help reverse the decline of town centres. They are also responsible for the annual publication Heritage and the Economy which includes a Heritage Economic Impact Indicators workbook. The workbook presents measures of heritage’s contribution to England’s economy. The workbook uses the following regions: North East, North West, Yorkshire and the Humber, East Midlands, East of England, London, South East and the South West allowing regional comparison. It aims to provide heritage stakeholders with an evidence base to support policy development and advocacy roles, and supplements the available public evidence providing greater transparency on public expenditure in this area.
Historic England commissioned Ortus Economic Research to update the workbook, first produced in 2016, which presents a range of indicators relating to tourism, property and public investment (drawn from various Historic England and public sources). To update findings on the economy and workforce indicators Ortus accessed Office for National Statistics (ONS) unpublished data in the Secure Research Service. The data were used to update current estimates of the size of the heritage workforce, and the contribution heritage makes to England’s Gross Value Added (GVA). Additional data, extracted from the Annual Survey of Hours and Earnings (ASHE), was used to refine the estimates in the 2016 workbook.
Methodology
To update findings on economy and workforce Ortus employed several different methodologies. Alongside the unpublished datasets of Annual Population Survey (APS) and Annual Survey of Hours and Earnings (ASHE), ORTUS also used publicly available ONS data Business Register and Employment Survey (BRES) and Annual Business Survey (ABS). Below is a summary of the core methodologies, whilst the full details are available in the Workbook link at the end of this document.
BRES classifies businesses using Standard Industrial Classification (SIC) codes. ORTUS selected the following SIC codes: (91.03) Historical sites and buildings, (91.01/2) Archives, (91.04) Gardens, (43.3) Building completion and finishing and (43.9) Other specialised construction activities. Ortus selected the following Standard Occupational Classification (SOC) codes: (2141) Conservation professionals, (2431) Architects, (2432) Town Planning Officers, (2434) Chartered Surveyors and (3114) Building and Civil engineering technicians. SOC codes are occupational classifications from the ONS Annual Population Survey (APS).
Economy
Heritage economic output is estimated using a method adapted from the Department for Culture Media and Sport (DCMS) Creative Industries Economic Estimates. The method is similar to those used by Ortus to estimate economic output for other activities difficult to define using SIC or SOC codes. The estimate for output is derived by apportioning the regional GVA estimates (published by ONS) based on earnings data from ASHE. National GVA is estimated by summing the regional estimates.
The previous iteration of the workbook used median earnings estimates from APS; ASHE provides more robust earnings data so was used to revise historical estimates by calculating median earnings for relevant heritage sectors and occupations. Due to small sample sizes at the regional level, national estimates were used; these were weighted by region according to the ratio between median earnings per region (all sectors/occupations) and the national average. Median earnings were then multiplied by estimated employment in heritage sectors and occupations to derive weighted earnings in heritage.
Workforce
Employment Estimates were collated from many different sources based on a definition which combines data on relevant SIC and SOC codes, collated with data on specific areas of heritage from other sources.
Because the relevant SIC and SOC codes often cover a broader range of activities than those which are relevant to heritage, multipliers are used to moderate employment estimates to focus more specifically on heritage employment. These multipliers are also derived from a number of different sources.
Findings for policy
In 2014, heritage directly generated £11.9 billion in GVA in England. With indirect and induced effects considered, the heritage sectors’ contribution to GVA increases to £22 billion. This is 2% of national GVA. Heritage employment including direct, indirect and induced accounted for 278,000 jobs.
The regional variances in both economically and concerning workforce are marked. London is the region with the highest GVA with £5,908m the lowest region being the North East with £977m. Workforce figures also have London topping the table with 50,300 jobs and the North East with the lowest with only 15,700. London therefore has a GVA of 6 times that of the North East whilst employment being only 3.2 times that in the North East. Such comparisons are available throughout the workbook.
The following illustrates key findings in Economy and Workforce for each region:
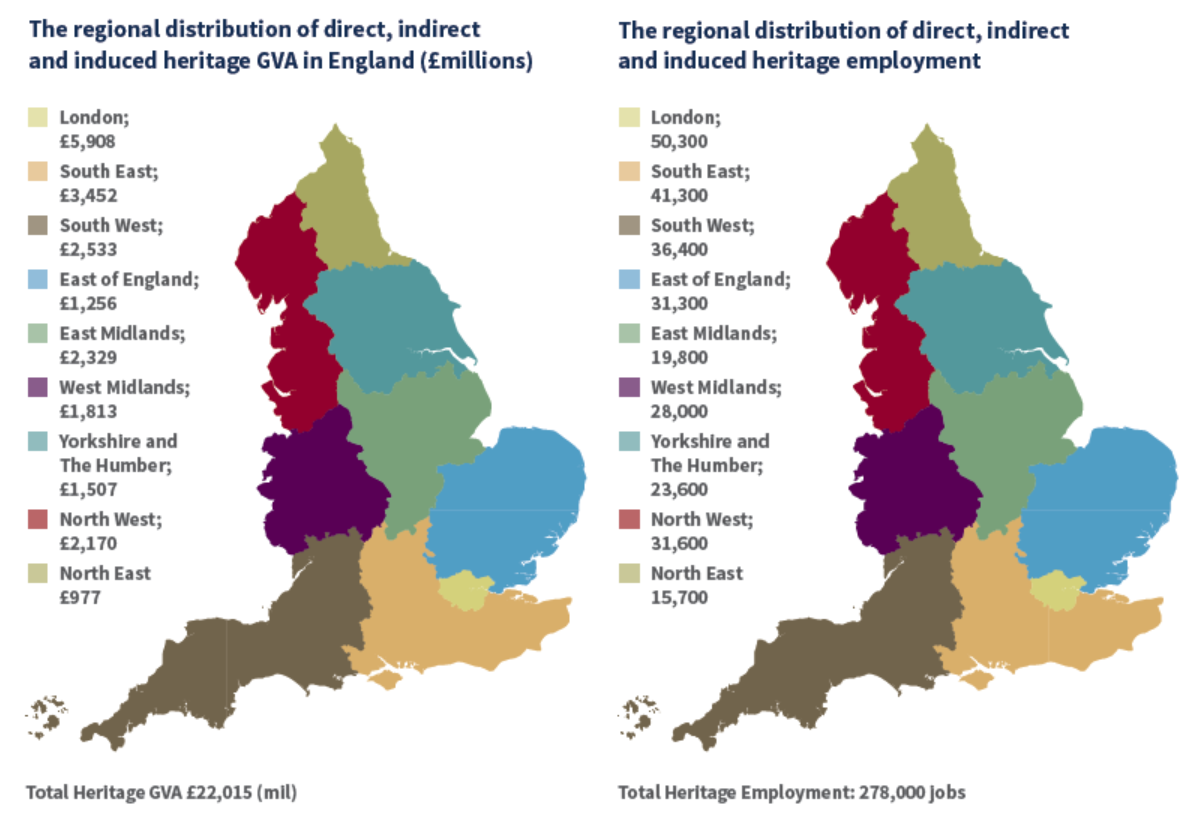
Figure 1 – Regional Distribution of Heritage GVA and Heritage Employment in England
(click to enlarge)
Economy
For each region, the workbook allows you to compare the GVA of broad sectors against the GVA of direct heritage from 2011 to 2014. The growth of heritage GVA during this period varies across the regions from -5.3% in Yorkshire and the Humber to 27.3% in the East of England.
In Figure 2 and 3 below we can see that the contribution heritage makes to GVA in the South West has grown by 7.3% between 2011 and 2014, whilst GVA in the West Midlands has increased by 17.2% for the same period.
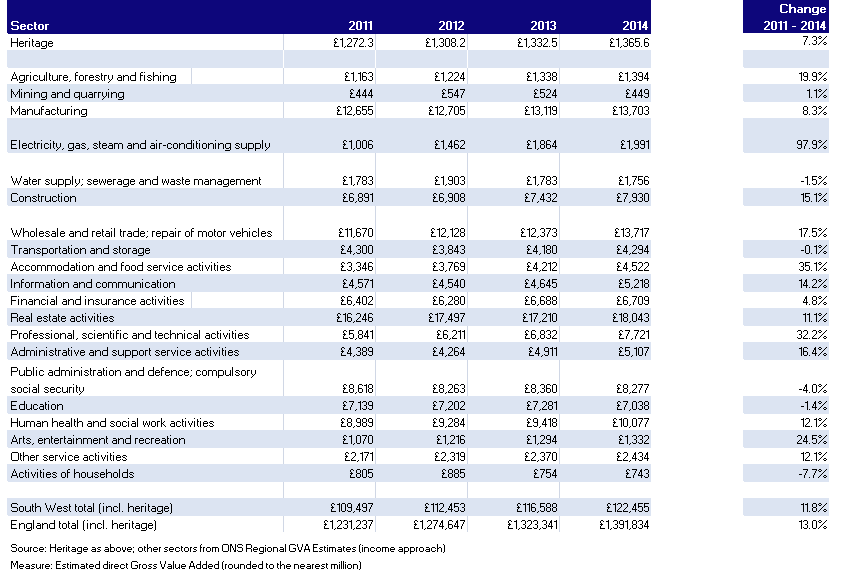
Figure 2 – Comparison with Direct GVA by broad sector, South West [£m]
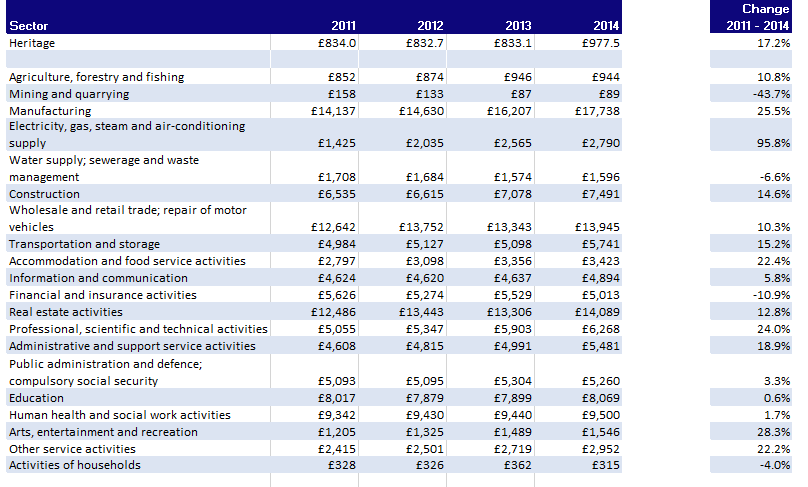
Figure 3 – Comparison with Direct GVA by broad sector, West Midlands [£m]
Workforce
The figures vary greatly across the nine regions in the workbook. By measuring from 2011 – 2014 the workbook allows identification of trends these vary widely by region. Yorkshire and the Humber had a -10.6% drop in employment whilst the East of England had a 15.8% increase across the period.
In the South West heritage employment fell by 3.1% while total employment in the region fell by only 1.7%.
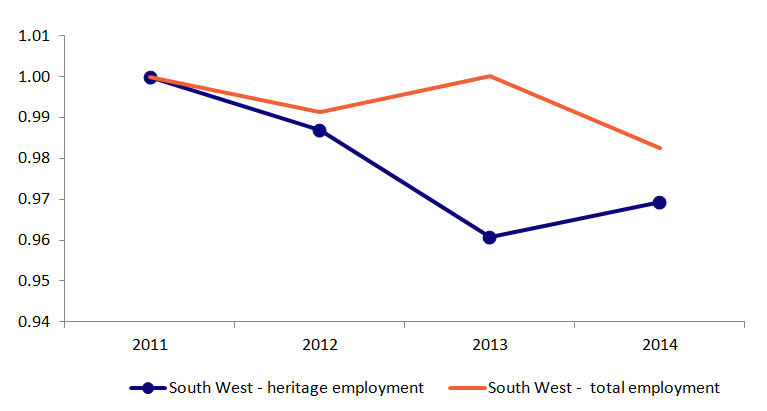
Figure 4. Indexed change: direct heritage employment vs. total direct employment, South West
In the North East the figures showed heritage employment increased by 9.1% whilst total employment decreased by 0.3%.
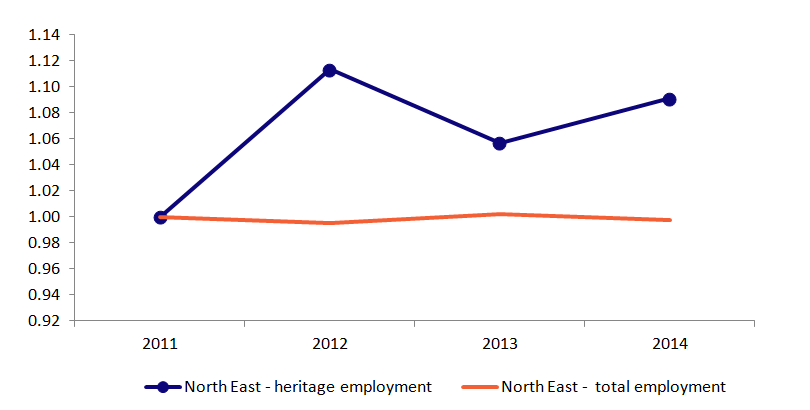
Figure 5. Indexed change: direct heritage employment vs. total direct employment, North East
Impact
Historic England is an executive non-departmental public body, sponsored by the Department for Digital, Culture, Media & Sport (DCMS) and is the governments’ statutory advisor on the historic environment.
The report has been cited in the DCMS Heritage Statement 2017 (published 05/12/17). This includes the sentence. This is the Government’s vision and strategy for Heritage and the historic environment:
And includes the following aim ‘Above all, we want to see more joint-working and partnerships at all levels between government, local authorities, national organisations, higher education institutions and the wider heritage sector to build and make the case for heritage and to help the heritage sector become more resilient and sustainable.’ This aligns nicely with the stated aim of the workbook ‘The solution was to empower the heritage sector with a mechanism and process by which they could extract meaningful data outputs relating to the regional economic impact of heritage’.
Read the Report
ORTUS Workbook 2017:
https://content.historicengland.org.uk/content/heritage-counts/pub/2017/heritage-economic-impact-indicators-2017.xlsm
Publications and outputs
Heritage Counts 2017: Heritage and the Economy:
Reports by region:


Data used in this case study are also available from the UK Data Service: