About the research
What does the National Travel Survey tell us about road injuries? How does self-reporting of injuries differ from police-reported data?
Dr Rachel Aldred’s work focuses on active travel, both walking and cycling. She is interested in enabling behaviour change and modal shift. Rachel also researches injury risk, including perceptions of safety and risk; near misses and unreported injuries.
Walking is increasingly seen as crucial to the future of sustainability in cities (for example, Scotland’s National Walking Strategy and TfL’s Healthy Streets approach in London), but there has been limited analysis of the risks and injuries to pedestrians.
Police injury data (Stats19 Road Safety Data) have limitations for researchers analysing injury risk by mode of travel and demography. Department for Transport data on deaths, and hospital data on injuries, can be used to supplement Stats19 data, however Rachel’s research using the National Travel Survey (NTS) identifies a systematic under-reporting of road injuries, especially minor ones.
Methodology
The research conducted new analysis of adult participants in the National Travel Survey secure dataset from 2007-15, accessed through the UK Data Service. The NTS is a rolling, cross-sectional survey of 147,185 adult individuals which comprises household interviews and a seven-day travel diary. The NTS covers Britain during 2007-12 and England only from 2013 to 2015.
Respondents to the survey reported incidents on ‘a public road, including pavements and cycle lanes […] even if no other party were involved’ over both the previous year and previous three years. No data on incident location or date are recorded, so there are no easy ways to match such incidents geographically with Stats19 or Hospital Episode Statistics (HES) data. The dataset includes incidents involving other road users as well as those that did not, less likely in general to be included in police injury data, and not at all in the case of pedestrian falls.
Respondents who have experienced an incident also report on injury or treatment, police involvement, travel mode used and involvement of others by travel mode. While pedestrians, cyclists, motorcycles and cars are listed as separate travel modes, all other vehicles are combined.
Initial preparation of the dataset included removing pre-2007 data and data on under-16s (who were not asked directly about incidents). New variables were created (e.g. relating to whether someone had been injured in their last incident), while selected variables (region and household income) were merged in from the household-level dataset, matched by household ID. Aggregation of data was also undertaken around trip stages within the past week. The aggregated data were merged into the individual-level dataset by individual-level ID. Individual-level weighting was used, apart from when analysing travel diary data, where diary weights were used.
Rachel used descriptive statistics to compare frequency of road injuries by mode, alongside per-hour and per-mile self-report injury risk by mode derived from National Travel Survey travel diary data. Per-mile risks were calculated for different demographic groups of pedestrians, for instance, disabled versus non-disabled pedestrians. She also compared the per-mile risks with Stats19 data, including published per-km rate-based tables, and frequency and modal split data.
Rachel built binary logistic regression models with outcomes being whether someone said they had been injured as a pedestrian in an incident involving a motor vehicle or in a fall. Factors included were:
- walking frequency,
- gender,
- age,
- disability,
- household income under £25,000
- resident or not in London.
As the number of pedestrians injured was relatively small, variables with little variation (e.g. ethnicity) or with many categories (e.g. region) were excluded.
The ‘general weekly frequency’ question to control for how much is walked is used because the National Travel Survey, on individual-level analysis, tends to skew towards reports of short walks on day 7 of the travel diary. In practice, there would likely be a higher number of other individuals doing additional walking. In addition, a high proportion (58%) do not report any walking in their diary (compared to 38% who say they walk once or not at all during the year in the general walking frequency question). Likely factors in play are the differing nature of questions versus travel diary, and the short walks issue described. The walking frequency questions has few missing values and was chosen as the most reliable measure.
Data used from the UK Data Service collection
National Travel Survey Secure Dataset, 2007-15
Findings
Incidents and injuries
The NTS included 17,980 respondents who said they had been involved in an incident in the past three years. Of this total, 5,610 reported having been injured when involved in their last incident. Respondents were also asked if any incidents had happened during the past year.
From the responses given, the number injured during incidents in the past year can be derived: 2474 people – 1.7% of the full sample. Comparing the results with injuries reported in Stats19 suggest five times more self-report injuries than are recorded by the police, roughly in line with a quarter of National Travel Survey incidents having involved the police being present.
|
Car |
Pedestrians |
Cyclists |
Motorcyclists |
Other vehicle users |
|
| All incidents by mode of travel |
84% |
4% |
5% |
2% |
5% |
| Incidents by mode of travel where an injury occurred (last three years) |
69% |
6% |
12% |
6% |
5% |
| Incidents by mode of travel where an injury occurred (past year) |
65% |
9% |
16% |
6% |
4% |
Figure 1 Incidents and injuries reported in the NTS by mode of travel
Both the ‘vulnerable’ groups of cyclists and pedestrians are disproportionately higher when considering only injuries over the last three years. The results are higher again when analysing only the past year’s data.
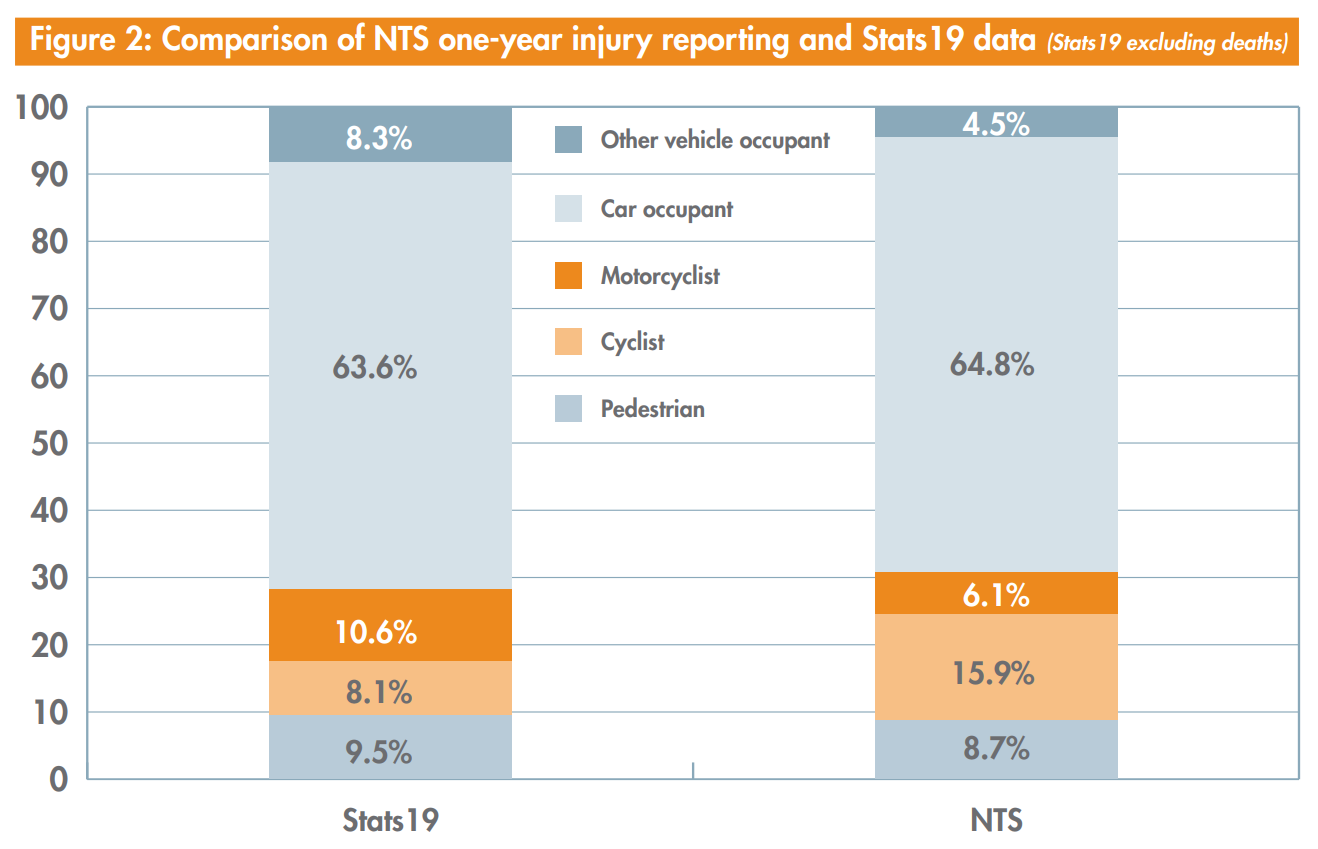
When comparing with Stats19 data on injuries reported, proportions of car occupants and pedestrians injured are roughly in line with injuries recorded in Stats19 data. For cyclists, the data show a large number of injuries not reported to the police, echoing perceptions of cycling as risky.

Figure 2 Comparison of NTS one-year injury reporting and Stats19 data (Stats19 data excluding deaths)
Larger version | Accessible version
The NTS includes a travel diary (covering a week) including data on time spent travelling by mode as well as distances travelled. Consequently, the NTS data can be analysed by ‘per hour travelled’ and ‘by mile travelled’, which reveals the highest and lowest risk groups by travel mode:
| Per hour travelled | Per mile travelled | |
| Highest risk group | Motorcyclists | Cyclists |
| Lowest risk group | Pedestrians | Car occupants |
Figure 3 Highest and lowest risk groups by per hour or per mile travelled
Compared with Stats19 data, the NTS data show around three times more injuries per mile for both walking and motorcycling. For car use the differential is higher and for cycling the NTS reports almost seven times as many injuries as are found in Stats19.
Injuries reported in the NTS are relatively minor, although severity varies between modal groups. Cyclists were more likely to report injuries such as cuts and bruises which did not require medical attention.
Who else is involved in incidents?
In analysing injury incidents within the past three years, 17.9% of incidents did not involve another vehicle or pedestrian. While injured car occupants were unlikely to report such injuries, just over a third of injuries reported by cyclists, motorcyclists and pedestrians reported single-bike incidents or falls.
There appears to be some under-reporting of pedestrian falls injuries (37% of injuries not involving anyone else) compared with other data sources such as hospital admissions. Possible explanations include respondents not remembering falls or not classing them as ‘road accidents’; and the likely exclusion of some of the most vulnerable pedestrians from the NTS (due to not living independently in a private household).
Analysis of incidents where an injury was self-reported shows that the majority involved a car (83%), with 13% involving other types of vehicles. Injuries involving a bicycle, motorcycle or pedestrian accounted for 1% each of the total.
Pedestrian falls and motor-vehicle related injuries
The NTS data contained 182 pedestrians who reported they had been injured in collisions with motor vehicles, and 121 who said they were injured in a fall. There were 23 pedestrians injured in either a cycle collision or in an incident involving other pedestrians (for instance, two pedestrians collide, and one falls).
The research identifies substantial inequalities in per-mile injury risks, for both motor vehicle collisions and falls.
Women were more likely both to be injured by motor vehicles and in falls. Over half of people reporting injuries from motor vehicles were aged under 50, while there was also an over-presentation of over 70s. Over half of people reporting an injury from a fall were aged 70+. The risk gap is largest for disabled pedestrians, who reported around five times more motor vehicle collision injuries per mile than non-disabled pedestrians, and six times more falls.
Living in a lower-income household (<£25,000) and living in London each doubled injury odds, and injury odds for disabled people were over four times higher than for non-disabled people. Injury odds fell with age, although given the association of age with disability, older people are at higher risk of being injured by a motor vehicle than are younger people.
The research demonstrates that being female or disabled each doubled injury odds, and injury odds grew with age.
The risk to pedestrians of being injured by a cyclist is low, with similarly low numbers of cyclists reporting having been injured in a cyclist-pedestrian collision.
Findings for policy
Dr Rachel Aldred said:
“Motor vehicles cause many more injuries than are recorded by police or hospitals. They put vulnerable pedestrians – many with few other options than to walk – at high risk. There is also a very high unreported toll of injuries to cyclists. While the data doesn’t tell us why these inequalities exist, it does suggest transport planning doesn’t do enough to protect the most vulnerable road users.”
Considering collision incidents, policy initiatives should focus on the threat motor vehicles pose to people walking and cycling, which for both represents the major road safety problem.
The risk of motor vehicle injuries is an equity issue, with disabled and low-income pedestrians at particularly high risk, groups which are more likely not to have access to a car. More research is needed into why disabled and low-income pedestrians are a high-risk group and how to reduce the risk.
Under-reporting of cycling injuries may be a factor in explaining the public’s perception of cycling as a risky activity. The high level of cycling injuries compared to walking injuries, generally involving a motor vehicle, supports policies to provide cycling provision protected from motor traffic.
High levels of falls injuries, particularly among older pedestrians, are a concern. Consideration should be given to including pedestrian falls within the scope of police injury statistics, as happens for cyclist single vehicle collisions, although there will be resource implications. Many falls (and single vehicle collisions) may be preventable and having spatial data about their incidence would be a necessary first step towards examining the causes of falls.
Impact
Rachel provided evidence to Parliamentary Select Committees including:
- the House of Commons Select Committee on Transport Road Safety Inquiry
- the House of Commons Transport Committee, Oral evidence on Active travel, Monday 17 December 2018 (particularly Q16, Q19, Q20)
The research findings have informed London councils’ Local Implementation Plans; statutory documents detailing Councils’ proposals for implementing the Mayor for London’s Transport Strategy:
- Southwark Council Local Implementation Plan, 2018 and Movement Plan: Setting a direction for transport
- London Borough of Hillingdon: Third Local Implementation Plan (LIP3) 2019 – 2041
- London Borough of Tower Hamlets: Third Local Implementation Plan
The research has been cited and discussed in publications by the International Transport Forum at the OECD (ITF). The ITF is an intergovernmental organisation with 60 member countries and is the only global body that covers all transport modes. Administratively integrated with the OECD, the ITF is politically autonomous.
- New Directions for Data-Driven Transport Safety. Corporate Partnership Board Report, May 2019
- Safer City Streets: Global Benchmarking for Urban Road Safety. Research Report, November 2018
A report on the research was launched at a stakeholder event. Living Streets and Sustrans contributed to the report foreword and have helped publicise the work.
Xavier Brice, the CEO of Sustrans said: “This research unearths vital insights into the many thousands of minor injuries occurring on UK streets and roads that go under-reported. It highlights the inequalities in injury risk and shows what a heavy burden motor-vehicles place on everyday life, particularly for disabled people, people cycling and people on low incomes. It shows that road safety is an equity issue and that if we get policy right for the most vulnerable, we get it right for everyone. This contribution should, therefore, inform future transport policy and practice, and offers timely evidence for the Department for Transport’s current Cycle and Pedestrian Safety Review.” (quote from Sustrans supports new research into road injury, Sustrans website, May 18 2018
Living Streets cited analysis from the research in their Response to the call for evidence: Cycling and Walking Investment Strategy Safety Review, March 9 2018.
The research was covered in a range of media including:
- Cyclists hurt seven times more often than figures show, The Times, May 17 2018
- Disabled and low-income pedestrians at ‘higher risk of road injury’, Road Safety GB, May 23 2018
- Road injury reporting comes under fire, Chartered Institution of Highways & Transportation (CIHT), May 23 2018
Publications
Aldred, R. 2018 Inequalities in self-report road injury risk in Britain: A new analysis of National Travel Survey data, focusing on pedestrian injuries. Journal of Transport & Health, Volume 9, June 2018, Pages 96-104. doi: 10.1016/j.jth.2018.03.006
Aldred, R. 2018. Road injuries in the National Travel Survey: under-reporting and inequalities in injury risk. London Department of Planning and Transport, University of Westminster.