Impact
The UK is fortunate in that there are a large number of high quality cross-sectional surveys which are available for reuse. Most government surveys have been available for secondary use since their inception. These surveys share some common features:
- they are large microdata files which contain a large number of detailed variables which require analysis within an appropriate package
- they form series of repeated cross-sections which enable comparisons over time for groups
- they are nationally representative, although ‘nation’ may mean the United Kingdom as a whole, Great Britain, or constituent countries: England, Wales, Scotland or Northern Ireland
- they are sample survey data, which may involve a degree of complexity, both in terms of their structure (many are household files, whereby data are collected for all household members) and sampling strategy
- the data holdings and documentation are extensive; users are more likely to be overwhelmed than starved of detail

There is a wealth of data for the study of topics of contemporary social interest and concern available using archived datasets.
What can a user do with the data?
Users are able to view datasets used in national policy such as the Crime Survey for England and Wales (formerly the British Crime Survey) and the Scottish Crime and Victimization Survey. Because each respondent’s record contains considerable detail, users are able to re-work the data in order to try different definitions or measurement approaches.
An example of such a study is that of Moore and Shepherd (2007 British Journal of Criminology 47, 154ff) who used the data to examine the relationship between age and fear of crime. They challenged approaches which grouped age and looked at fear of crime as a monolithic concept. They concluded that fear of crime is reducible to two dimensions: fear of property loss and fear of personal harm. Neither is related linearly with age. Fear of personal harm falls with age from around 25 years, while fear of property loss increases to the age of around 40-60, then falls again.
While the crime surveys are the most obvious government survey relating to crime and social control, other sources may link crime and other issues. McLaren and Johnson (2007 Political Studies, 55, 709ff) used the British Social Attitudes Survey to look at the extent to which hostility to immigration can be explained by a belief that immigration results in increased crime rates. They find that the belief is associated with anti-immigration hostility, although less strongly than competition over jobs.
Government data are exciting resources for students. A recent pilot study at the University of Manchester used one of several teaching datasets based on the British Crime Survey in workshops designed to equip undergraduate students with the skills to use archived datasets in their dissertations.

How do I find data on a subject such as fear of crime?
Naive users may simply start their search with a web search: a Google search on ‘crime survey’ will result in links to appropriate UK Data Service web pages within the first page or two of hits. From the UK Data Service home page users can readily access a range of tools to find data and/or information. These include:
- a catalogue search tool which enables users to perform faceted searches
- a list of key data which allows users to quickly locate the best known datasets
Search results from our data catalogue link to the appropriate catalogue records which provide summary information about the surveys and links to the full documentation, the data (including links to download the data, in standard formats such as SPSS and Stata, for offline data analysis and links to the online data analysis tool, Nesstar), and specialist support and/or registration facilities as appropriate.
Using data
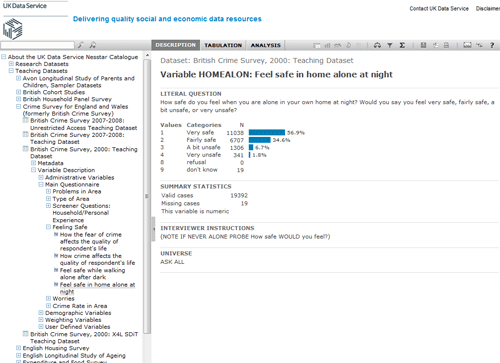
If researchers wished to use the BCS 2000 Teaching Dataset to understand the composition of the group of respondents who say they feel unsafe at home at night they would need to know whether there were a sufficiently large number of people in the dataset groups of interest. The screenshot below shows the Nesstar distribution of the BCS 2000 Teaching Dataset ‘homealon’; it gives the wording and applicability of the question as well as the distribution of the variable. Users can see that this dataset contains 341 individuals who feel very unsafe and 1,306 who feel a bit unsafe.

See the Crime and Social Control theme pages for more information.
