SecureLab User Experience Survey
What can we learn from our users?
We recently ran a SecureLab user experience survey for our current and future SecureLab users (conducted, analysed and reported by Istvan Laszlo Gyimes) because we want to provide the best service we can. We wanted to get a better understanding of our users’ preferences. We learnt that Stata is the most widely used software and we identified a number of areas where we could improve the service even further.
What we learnt…
About our users
Most current and future SecureLab users are academic researchers and students (Figure 1).
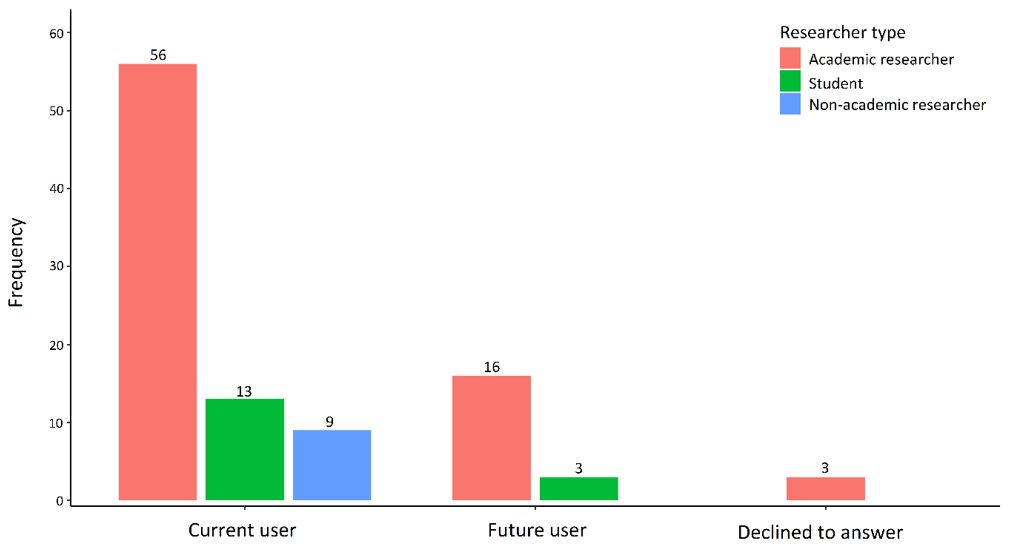
Figure 1. Frequency of user types. Participants were asked if they were current users of SecureLab or planning to use it in the near future.
About the software and packages used
We also asked our users which software packages they currently use when accessing SecureLab. Most people are using Stata, alone or together with Python or R. While there are researchers that prefer SPSS or MLwiN, the majority of our users are using Stata, R and/or Python (Figure 2).
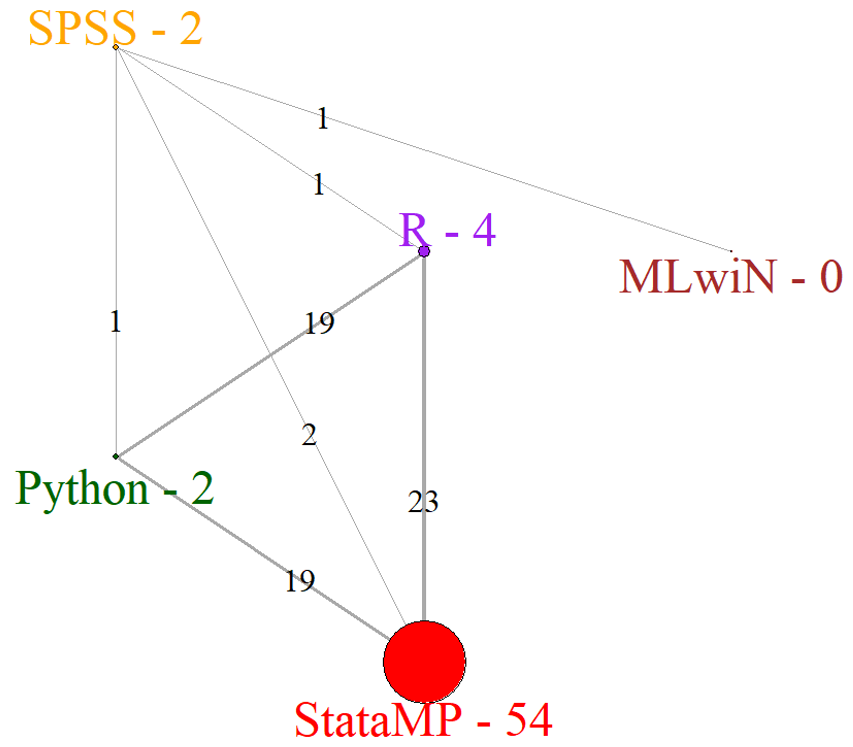
Figure 2. Network plot of software used by researchers. Nodes represent the software used. The thickness of the connections indicates the frequency of the connected software being mentioned/used together. The numbers after the software names represent the frequency of the software being mentioned alone, while the numbers on the connections represent the number of times the two software were mentioned together.
In addition, we asked about how much experience users have with the software they are using. Most Stata users classified themselves as Advanced or Expert, while the other software users were distributed more evenly between the Beginner and Expert groups (Figure 3).
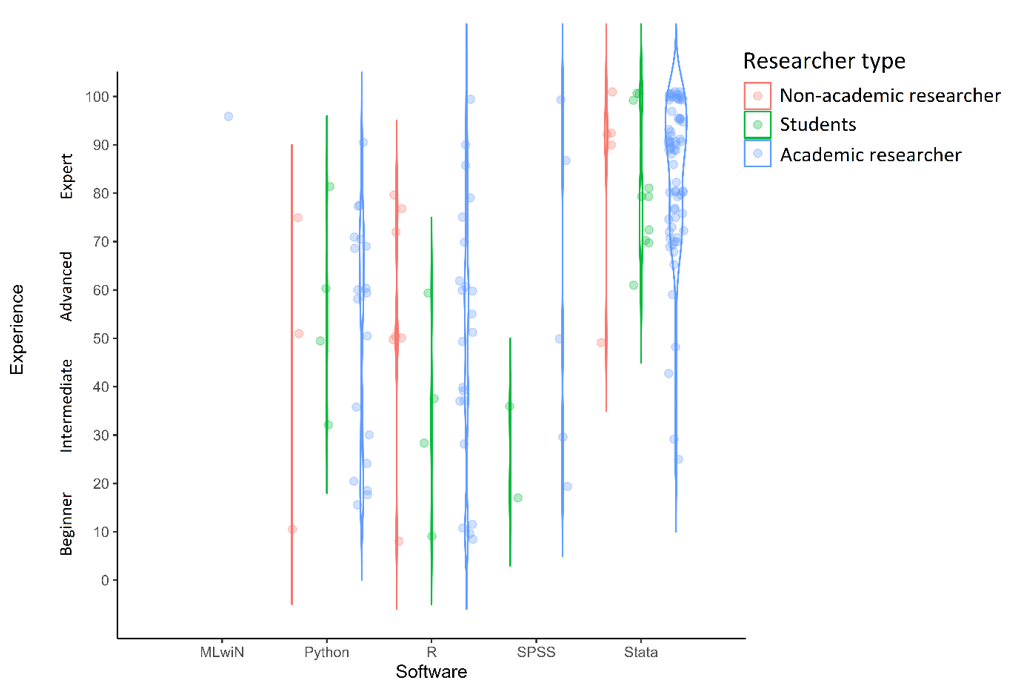
Figure 3. Subjective ratings of one’s level of experience in using software by researcher type (academic researcher, non-academic researcher and student). The dots represent individual ratings, while the violin plots represent the distribution of ratings.
Last, but not least, we asked researchers about the type of analysis they are conducting in SecureLab. Most people are doing more than just one analysis type, but the most frequently mentioned analyses were regression models, descriptive statistics, econometrics and longitudinal data analysis (Figure 4).
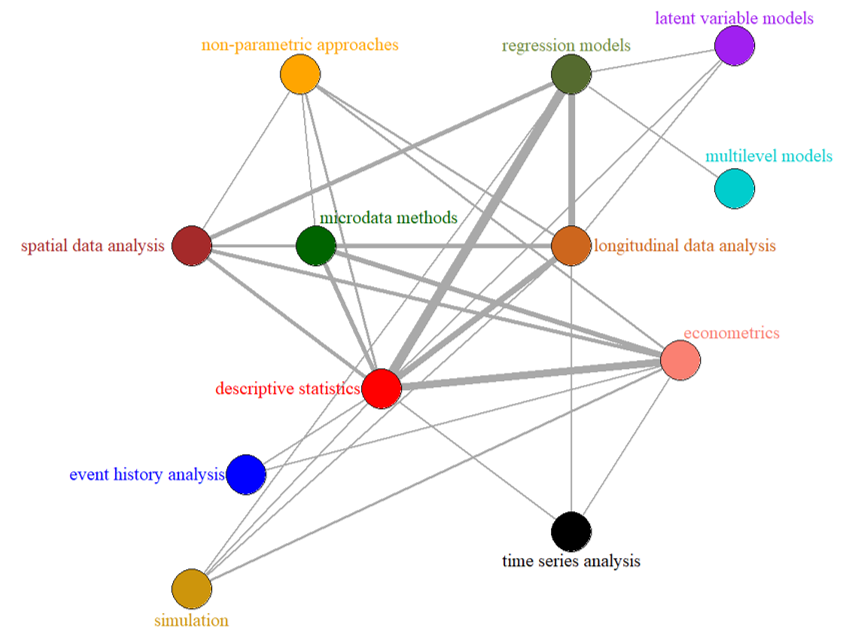
Figure 4. Network representation of co-mentions of analysis methods.
Ideas for improvement
We did not collect all of this information just to produce some colourful plots. We asked people about their software preferences (Figure 2) and their most frequently used packages (Figure 5) so we can develop an even more proactive method for managing SecureLab. Based on the feedback from users, we identified three major areas where we could improve the service further, as we continue to seek ways to optimise the service:
- Make it even clearer what is already available on SecureLab.
- Speed up the processing speed even more of SecureLab.
- Speed up the ability to access data even more from SecureLab.
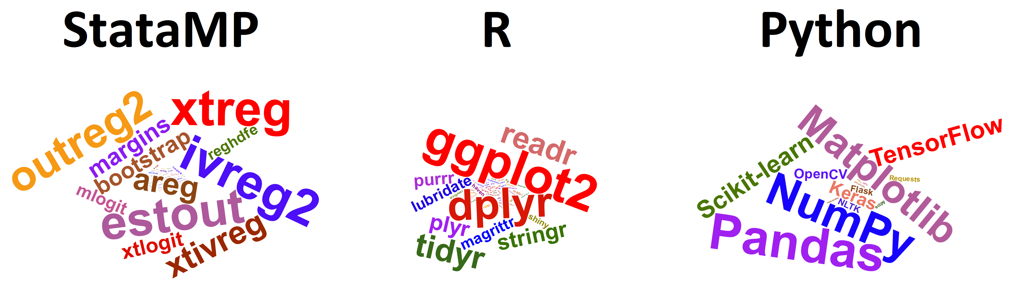
Figure 5. Wordclouds representing the most frequently mentioned packages. This indicates the packages we need to keep up to date the most.
Our response
- New catalogue for SecureLab:
- We want to make sure all our users have access to an easy-to-use catalogue that will show all resources available on SecureLab.
- This catalogue is being developed together with our efforts to re-organise the References drive on SecureLab.
- New repositories on SecureLab:
- We have implemented a local R repository on SecureLab that we update weekly.
- We are working on implementing a similar local repository for Python.
- We are developing automated methods to keep Stata ADOs up to date. (Update: During spring 2024, we managed to fix our long-lasting issue with NEXUS repository manager for R and Python. We will be distributing template syntax files to facilitate the switch from our local repositories back to NEXUS.)
- Revising data access and import request forms:
- We rolled out a new version of the Import request form to make the process easier and faster, and we are revising other forms as well.
- Investigating how to improve SecureLab performances even further:
- Our IT team is investigating every occasion when SecureLab performances could be sped up even further, adjusting resources accordingly so that all researchers can conduct their research effectively as possible.
- Future plans:
- We plan to run more user experience surveys in future to investigate different aspects of the everyday interaction between the UK Data Service and our users. Keep an eye out for surveys in our emails, social media updates and on our website so you can make your voice heard and contribute to making the service stronger than ever!