Census boundary data
What are digitised boundary datasets?
Census area statistics provide counts of people or households for geographical areas broken down by socio-demographic characteristics such as age, gender or employment.
Digitised boundary datasets (sometimes referred to as DBDs or boundary data) are a digitised representation of the underlying geography of the census. They are often used within Geographical Information Systems (GIS) or Computer aided Designs (CAD) systems.
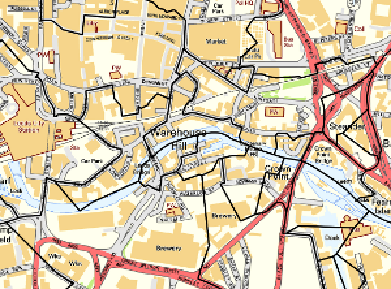
Figure 1: Digital boundary example
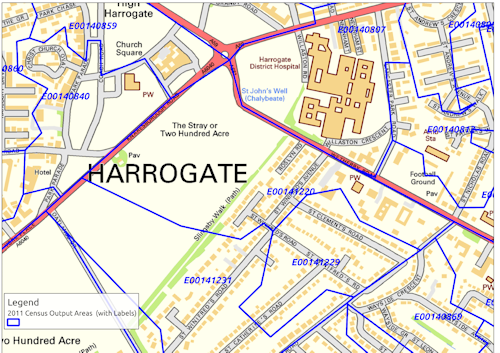
Copyright statement: Contains National Statistics data © Crown copyright and database right 2021. Contains Ordnance Survey data © Crown copyright and database right 2021.
The geography of the census consists of a hierarchical subdivision of UK local government areas of various types down to sub-authority areas, such as wards, to lower levels created specifically for census purposes such as enumeration districts in 1971, 1981 and 1991 or output areas in 2001 and 2011. The smallest units can then be aggregated to produce larger areas – for 2011 Census these include Super Output Areas which come in two forms – Lower SOAs and Middle SOAs with the latter being the larger. New geographies also exist for the 2011 Census, specifically the Workplace Zones and Census Merged Wards. Readers should consult the Office for National Statistics (ONS) product guide for a fuller description.
For example, the geography of the 1991 Census for England consisted of a 4-level hierarchy: enumeration districts (EDs) at the lowest level nest within wards, districts and counties.
Figure 2: 2011 Census Geography hierarchy going from Country to Local Authority to Middle Layer Super Output Area (MSOA) to Lower Layer Super Output Area (LSOA) to Output Area
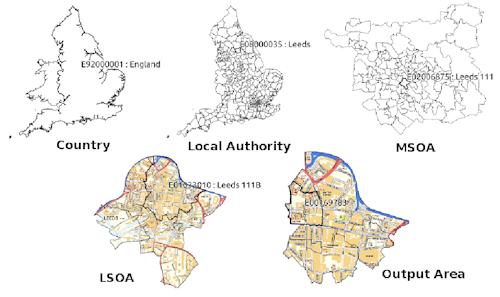
Copyright statement: Contains National Statistics data © Crown copyright and database right 2021. Contains Ordnance Survey data © Crown copyright and database right 2021.
The digitised co-ordinates (points, lines, areas) which make up these census geographies are available as digitised boundary datasets. These form the areal representation buckets against which various census statistics e.g. counts of households, proportion of males:females etc. can be associated and subsequently visualised and analysed.
What can digitised boundary datasets tell us?
Census area statistics contain a pointer (generally a code such as E09000022 which represents the 2011 code for the London Borough of Lambeth), to the geographical census areas to which they relate. By linking census area statistics with the corresponding digitised boundary datasets for a specific census year, the census attributes can be visualised as a map. Mapping census datasets in this way allows for an exploration of the characteristics of census datasets geographically and may provide additional demographic, socio-economic and cultural insights into the census data.
As an example, it is possible to explore the patterns of housing tenure recorded in the census – such as the proportion of people who live in local authority housing. By linking the census statistics to DBDs of county boundaries or outputs areas within a specific region/area and producing a shaded choropleth map of the numerical values held in the census dataset, it can be shown how housing in one region/area differs from another and whether there are any interesting patterns in the geographical distribution of census variables.
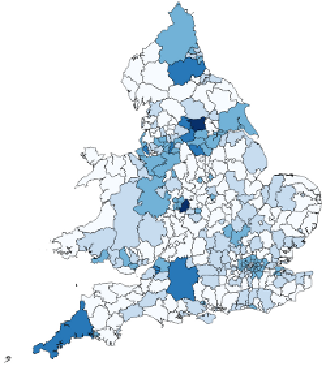
Figure 3: Choropleth map showing proportion of people working more than 49 hours per week by South East England Local Authority as recorded by the 2011 Census.
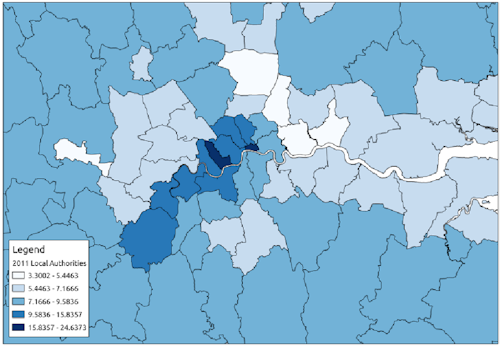
Copyright statement: Contains National Statistics data © Crown copyright and database right 2021. Contains Ordnance Survey data © Crown copyright and database right 2021.
Using the census statistics and boundaries in a Geographical Information System (GIS) allows for spatial analysis of the census data and its combination with other non-census geographically referenced datasets.
Digitised boundary datasets can be used for:
- map production for research articles
- data synthesis and development of residential neighbourhoods
- geostatistical analysis of demographic or employment change
- small area analysis and deprivation studies
- health care research – incidence mapping and analysis
- historical demographic research.
The geography of the decennial census is not fixed. For the same physical local area, the output geography used in the 1971, 1981, 1991, 2001 or 2011 Censuses may be quite different.
Figure 4a: 2001 Census Output Areas in Leeds city centre drawn on top of a 2011 Ordnance Survey map.
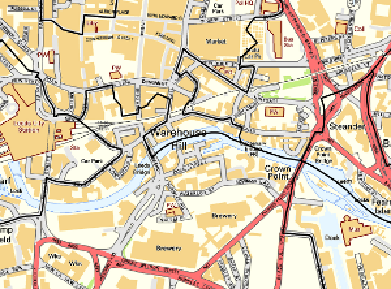
Contains National Statistics data © Crown copyright and database right 2021. Contains Ordnance Survey data © Crown copyright and database right 2021.
Figure 4b: 2011 Census Output Areas for the same location in Leeds city centre. Some 2001 Census Output areas have been split for 2011 to ensure Output Area population thresholds are retained given new urban housing developments between 2001 and 2011.
Significantly, different research questions may require mapping of the same census statistic at different scales and in different locations.
Figure 5a: 2011 Census population by all English and Welsh Local Authorities.
Copyright statement: Contains National Statistics data © Crown copyright and database right 2021. Contains Ordnance Survey data © Crown copyright and database right 2021.
Figure 5b: 2011 Census population by all Lower Layer Super Output Areas within Leeds Local Authority. The same census statistic can be analysed at different geographic scales.
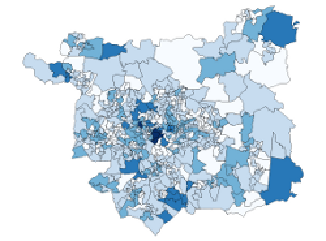
Copyright statement: Contains National Statistics data © Crown copyright and database right 2021. Contains Ordnance Survey data © Crown copyright and database right 2021.
Obtaining census boundary data
We provide support for and access to a variety of facilities and tools by which users can use the full collection of digitised boundary datasets and supporting datasets, including geographic look-up tables.
These datasets are available either pre-packaged or through dynamic user-driven interfaces permitting user-defined custom selection of boundaries and look up tables. Quick access to the most regularly requested boundaries as ready-to-use national datasets is also provided.
Functionally more complex data extraction facilities allows users to select boundaries for any specific area required, for the census year required, and in a range of different data output formats. This flexibility allows users to download census output areas for several counties or for a specific ward or district. During the boundary selection process, the chosen boundaries can be previewed over a topographic back-drop map before finally being extracted in one of several data formats for use with different GIS and mapping packages.
The range of tools available include:
Easy Download: This facility lets users quickly download the most regularly requested census boundaries available in popular formats.
Boundary Data Selector: This facility lets users select the boundaries they want, for the areas they want, in the format they want.
GeoConvert: This facility lets users obtain and manipulate complex geographical and postcode data in a straightforward way.
Postcode Data Selector: This facility allows users to download the set of postcodes that you want from postcode directories released between 2001 and the present day.
Postcode Directory Download: This facility allows users to download complete versions of current and historical postcode directories (sometimes referred to as look-up tables).
WICID (Web-based Interface to Census Interaction Data): This facility allows users to select and download migration and journey-to-work flow data collected by the census of population.
What data are available?
Many boundary types are available for England, Wales, Scotland and Northern Ireland (2001 and 2011 data only) including:
- Census boundaries e.g. 2011, 2001, 1991, 1981 and 1971 Census boundaries
- Administrative boundaries e.g. districts, unitary authorities, health boundaries
- Electoral boundaries e.g. wards, parliamentary constituencies
- Environmental boundaries e.g. national parks, urban footprints
- Postal boundaries and postcode-related boundaries
- Historical boundaries pre-1971 census and administrative boundaries from 1840 onwards
- Other boundaries e.g. synthetic neighbourhood localities.
Important supporting datasets include geographic look-up tables. These include versions of the ONS Postcode Directory (ONSPD) from the Office of National Statistics which provides details of the locations of current and historic postcodes along with details of other geographic areas in which the postcode is located.
Such datasets provide a valuable means by which events or occurrences (such as disease, crimes, customer residence etc.) can be allocated from a postcode to another area such as an electoral ward or health area.
How to download boundary data
View our video tutorial on how to download boundary data offering a range of digitised boundary data including boundaries designed for use with census data in several GIS geographic information system formats.
Further reading
UK census geography
ONS Census Geography web pages
Geo-Refer (2007) Geographical referencing learning resources
Rees P., Martin D.M. and Williamson P. (2002) The census data system, Chichester: Wiley.
Stillwell, J. (ed.) (2018) The Routledge Handbook of Census Resources, Methods and Applications Unlocking the UK 2011 Census, ISBN 9780367660031, Routledge.
Handling spatial data and GIS
Longley P.A., Goodchild M.F., Maguire D.J. and Rhind D.W. (2001), Geographic information systems and science, Chichester: Wiley.
Martin, D. (1996) Geographic information systems: socioeconomic applications, London: Routledge.
Monmonier, M. (1996) How to lie with maps, Chicago: University of Chicago Press.
Walford, N. (2002) Geographical data: characteristics and sources, Chichester: Wiley.